Stock trading apps tackle some unique technical challenges. They're not just another app. They're fast-moving platforms where timing is everything, and getting accurate, real-time information to users immediately can make a huge difference in their financial decisions. Figure 1 shows some of the most popular stock trading apps in the industry.
The core challenge lies in managing high-frequency data streams. Every price change and market shift needs to reach users with minimal delay, as even a few seconds of latency could mean missed opportunities.
And it's not just about being fast. These apps handle real money and sensitive financial information, so security and reliability must be robust. We need to build in strong security, dependable APIs, and make sure we're following financial regulations to keep things running smoothly and safely.
To figure out what we're building, let's picture a quick conversation with an interviewer. This back-and-forth helps us define the app's main features and set some clear boundaries.
Candidate: Before we dive in, I'd like to understand the scope of the trading functionality we're building. What's our stock trading app focusing on? Just stocks, or are we considering other instruments, such as options and futures too?
Interviewer: Let's keep it straightforward for now and focus on stocks.
Candidate: Sounds good. I'm thinking of key features such as placing and canceling orders, viewing portfolio details, showing real-time prices, and historical data. Does that cover it?
Interviewer: Pretty much! Let's also add a simple chart for historical stock trends. It'll give users a better sense of what's happening.
Candidate: How about push notifications for price alerts? And what kind of scale are we looking at? Big user base across multiple markets?
Interviewer: Definitely add notifications. For scale, we're looking at around 500k daily active users across different markets. The app needs to handle market data for thousands of stocks with real-time price updates.
Candidate: Given the focus on security and compliance, I propose minimizing sensitive data storage on the device and implementing robust security measures. Should we include authentication in the scope?
Interviewer: Good call. Let's assume users are already authenticated. Tech-wise, consider this a greenfield project.
Based on that discussion, here's what our stock trading app needs to deliver:
As for non-functional requirements, we need to build a system that ensures:
Features that are out of scope for this exercise:
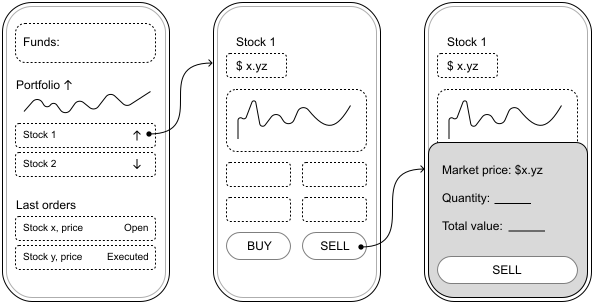
Let's think about how the app will look. Figure 2 lays out the main screens:
Now we'll establish how our client and backend will communicate. We'll focus on the communication protocol, client-backend interactions, and core data models.
The stock trading app requires two primary forms of interaction: standard client-server exchanges, such as submitting orders or retrieving portfolio details, and real-time updates, such as live stock price feeds. To meet these demands efficiently, we adopt a hybrid protocol strategy:
This combination provides a good balance between standard request-response patterns and continuous data streaming. Many trading platforms such as TradeRepublic [1] use this tech stack, confirming its effectiveness at scale.
With the communication protocols established, let's dive into the specific endpoints and data models we'll need.
These endpoints provide access to stock information and historical trends:
GET /v1/stocks/{symbol}
retrieves detailed data for a specified stock, including current price, daily high/low, and percentage change.
GET /v1/stocks/{symbol}/history
?interval={interval}&period={period}
supplies historical price data, with parameters allowing customization of time intervals (e.g., 1m for one minute, 1d for one day) and periods (e.g., 1wk for one week, 3mo for three months).
The corresponding data model is:
| Kotlin | Swift |
|---|---|
| data class Stock id: String symbol: String name: String currentPrice: BigDecimal changePercent: BigDecimal highPrice: BigDecimal ... | struct Stock id: String symbol: String name: String currentPrice: Decimal changePercent: Decimal highPrice: Decimal ... |
📌 Remember:
For financial apps such as stock trading platforms, always use BigDecimal in Kotlin or Decimal in Swift instead of Float or Double types.
Floating-point types (Float/Double) can introduce subtle rounding errors that are unacceptable in financial contexts. BigDecimal provides exact decimal representation and precise arithmetic operations. While those operations are somewhat slower than primitive types, the guaranteed precision is essential for maintaining data integrity.
These endpoints facilitate portfolio management and trading:
GET /v1/portfolio
provides the user's current portfolio, detailing owned stocks and quantities.
GET /v1/orders?status={status}&page={page}&limit={limit}
returns a paginated list of orders, filterable by status (e.g., open, executed, canceled).
POST /v1/orders
creates a new buy or sell order.
DELETE /v1/orders/{orderId}
cancels an existing order.
For order history, we implement offset pagination. This approach works well for this use case because:
The data models are defined as:
| Kotlin | Swift |
|---|---|
| data class Portfolio stocks: List<PortfolioStock> | struct Portfolio stocks: [PortfolioStock] |
| data class PortfolioStock stock: Stock quantity: BigDecimal averagePrice: BigDecimal | struct PortfolioStock stock: Stock quantity: Decimal averagePrice: Decimal |
| data class Order id: String stockSymbol: String quantity: BigDecimal status: OrderStatus createdAt: String ... | struct Order id: String stockSymbol: String quantity: Decimal status: OrderStatus createdAt: String ... |
| enum class OrderStatus OPEN, EXECUTED, CANCELED | enum OrderStatus case open, executed, canceled |
To support price alerts, we include:
GET /v1/notifications
gets all created alerts.
POST /v1/notifications
establishes a new price alert for a stock.
DELETE /v1/notifications/{id}
deletes an existing alert.
For real-time functionality, we establish a WebSocket connection at wss://api.stocktrading.com/ws. This supports message types such as:
Clients subscribe to updates by sending events like:
{
  "action": "subscribe",
  "channels": [
    {
      "name": "stock-prices",
      "symbols": ["AAPL", "GOOGL", "MSFT"]
    }
  ]
}
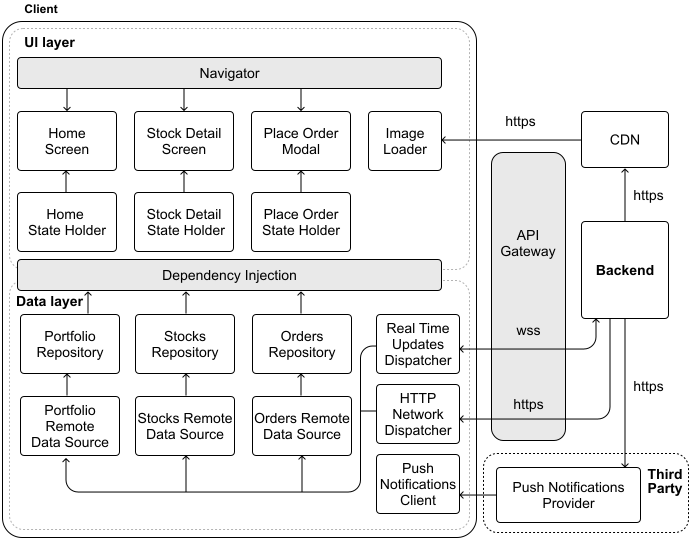
With our API design in place, let's develop the high-level mobile architecture. Figure 3 illustrates this architecture, with arrows showing the flow of data through the system.
Let's see how the key components of our architecture interact with each other.
Before we get into the client itself, let's look at the external pieces it relies on:
In our stock trading app, security is non-negotiable. We need robust authentication, careful request monitoring, and strict policy enforcement—all while maintaining a seamless user experience. This is where the API Gateway [2] plays a crucial role.
Serving as our system's front door, the API Gateway validates and routes all incoming client requests to the appropriate backend services. It blocks any suspicious or unauthorized requests before they can reach our core systems.
The API Gateway handles several key responsibilities:
Our app follows a clean layered architecture that separates concerns between the UI and data layers, creating a more maintainable and testable codebase.
The UI layer consists of three primary screens, each backed by its own state holder to manage presentation logic:
Behind the scenes, three specialized repositories handle the core business data in the data layer:
Complementing these components, the Push Notifications Client component listens for important alerts from our backend, ensuring users receive timely updates about price movements, order completions, and other critical events.
In our stock trading app, data freshness requirements vary across different types of application data:
This architecture provides a solid foundation for our stock trading app. Now let's dive deeper into some of the more complex aspects of our system.
There are some unique aspects of our app that deserve special attention. Let's take a closer look at creating historical stock price charts and real-time stock data.
Visualizing historical price data is essential in any stock trading app. Historical stock data typically comes in various time frame options such as daily, weekly, monthly, yearly, and max views; each offering different insights to traders as shown in Figure 4.
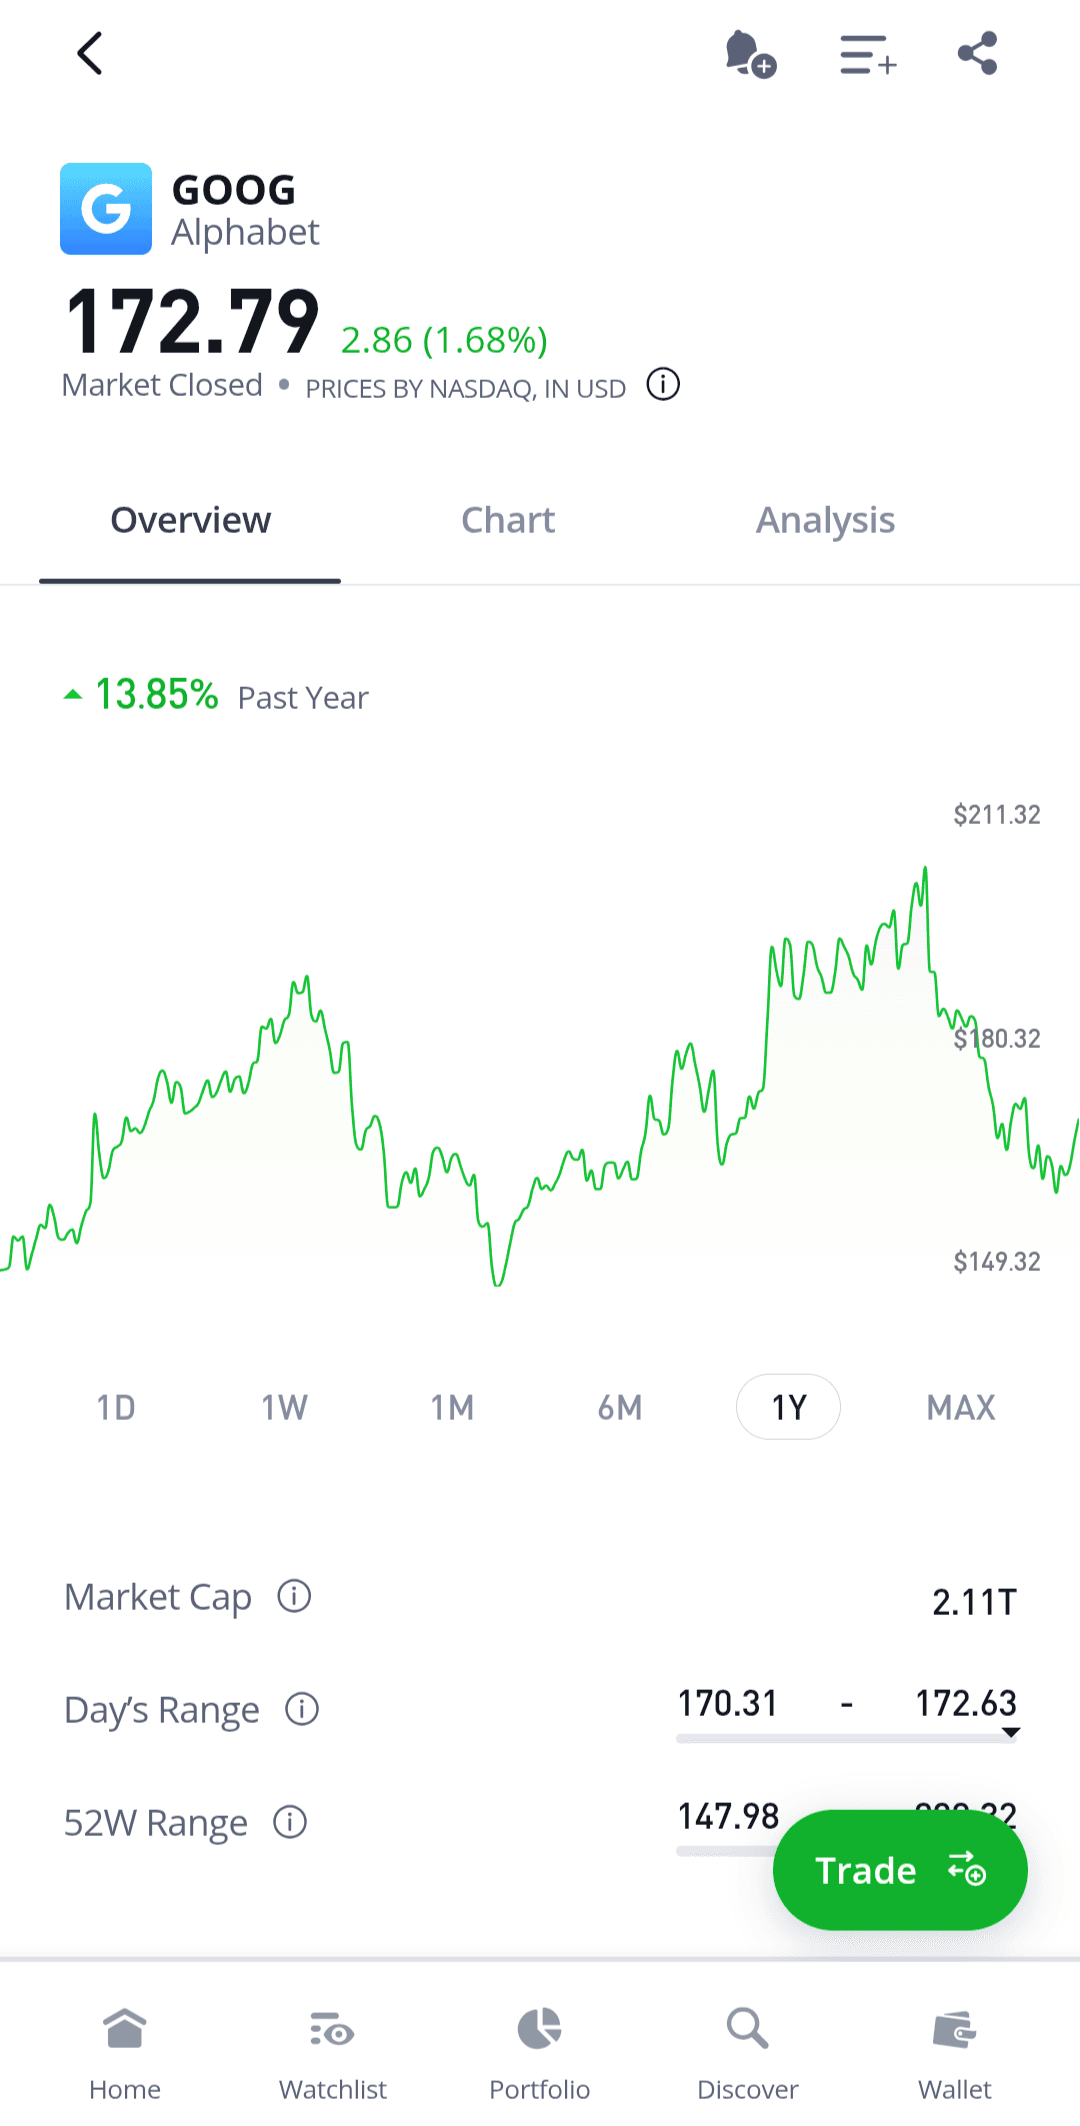
from the eToro Android app
Each time frame presents unique data handling challenges. For instance, a 1-day chart might require 390 individual data points (one per minute during a 6.5-hour trading day), while a 5-year chart could theoretically contain over 1,250 daily data points or more than 260 weekly points.
One key challenge when implementing historical charts is managing data density appropriately. More data points provide greater detail but come with performance costs:
🔍 Industry insights:
Different stock trading apps provide different user experiences. Many of these product decisions influence how the charts are designed and displayed. If you're interested in this topic, here's more information on how charts work in the Robinhood app [3] and in eTrade [4].
Rendering historical stock charts on mobile devices presents unique challenges due to the combination of large datasets and limited screen space. Let's evaluate the different approaches available to us in Table 1:
| Option | Description | Advantages | Disadvantages |
|---|---|---|---|
| Native graphics rendering | Using platform graphics APIs (e.g., Android Canvas, iOS Core Graphics) to draw chart UI elements manually. | Full control over visuals and performance. Smallest memory footprint. Direct hardware acceleration. | Complex implementation requiring platform-specific expertise. Significant development time. Duplicate code across platforms. |
| Third-party libraries | Using established mobile charting libraries (e.g., MPAndroidChart [5] or ChartsOrg/Charts [6]) that provide ready-made components. | Quick implementation with built-in features like zooming and gestures. Well-documented and maintained. | Performance overhead compared to native solutions. Potential integration challenges with native components. |
| WebView-based rendering | Embedding web tools (e.g., D3.js, Chart.js) or professional offerings (e.g., TradingView [7]) in a WebView. | Rich feature set from the web charting ecosystem. Consistent implementation across platforms. | Performance overhead and higher memory usage. WebView/native integration challenges and less native feel. |
| Server-side rendering with Image API | Generating charts server-side and delivering images to the client. | Minimal client-side processing requirements. Works consistently across all devices. | Limited interactivity. Network dependent. Higher server costs and bandwidth usage. |
Table 1: Trade-offs for presenting historical stock price charts on the client
Given our business context with multiple clients sharing the backend, we'll implement charts using WebView-based rendering. This approach allows us to maintain consistent visualization across platforms while leveraging powerful web-based charting libraries optimized for financial data visualization.
Implementing charts through WebViews presents several important challenges we need to address.
While WebViews offer flexibility, using complex JavaScript charting libraries such as D3.js or ECharts can strain device resources. We can mitigate this by:
The historical stock data density also presents unique challenges. We should implement the following strategies:
WebView-rendered charts may not match the smooth interactions of native implementations, particularly with complex user interactions. To ensure good performance, we:
WebView components can sometimes feel disconnected from the native UI. To create a cohesive experience, we'll bridge this gap by:
Each OS presents unique hurdles:
By carefully considering these challenges during implementation, we can create chart experiences that balance functionality with performance while maintaining a native feel.
🔍 Industry insights:
eToro opted to integrate the web-based TradingView [7] charting toolkit into their platform, delivering advanced interactive charts via a web component in their app.
Robinhood uses native drawing APIs to maximize performance and control on Android. They open sourced a custom Android library called Spark [8] for their sparkline charts.
Stock prices fluctuate rapidly during trading hours, often changing multiple times per second. To display these dynamic changes, stock trading apps typically use intraday charts such as the one shown in Figure 5.
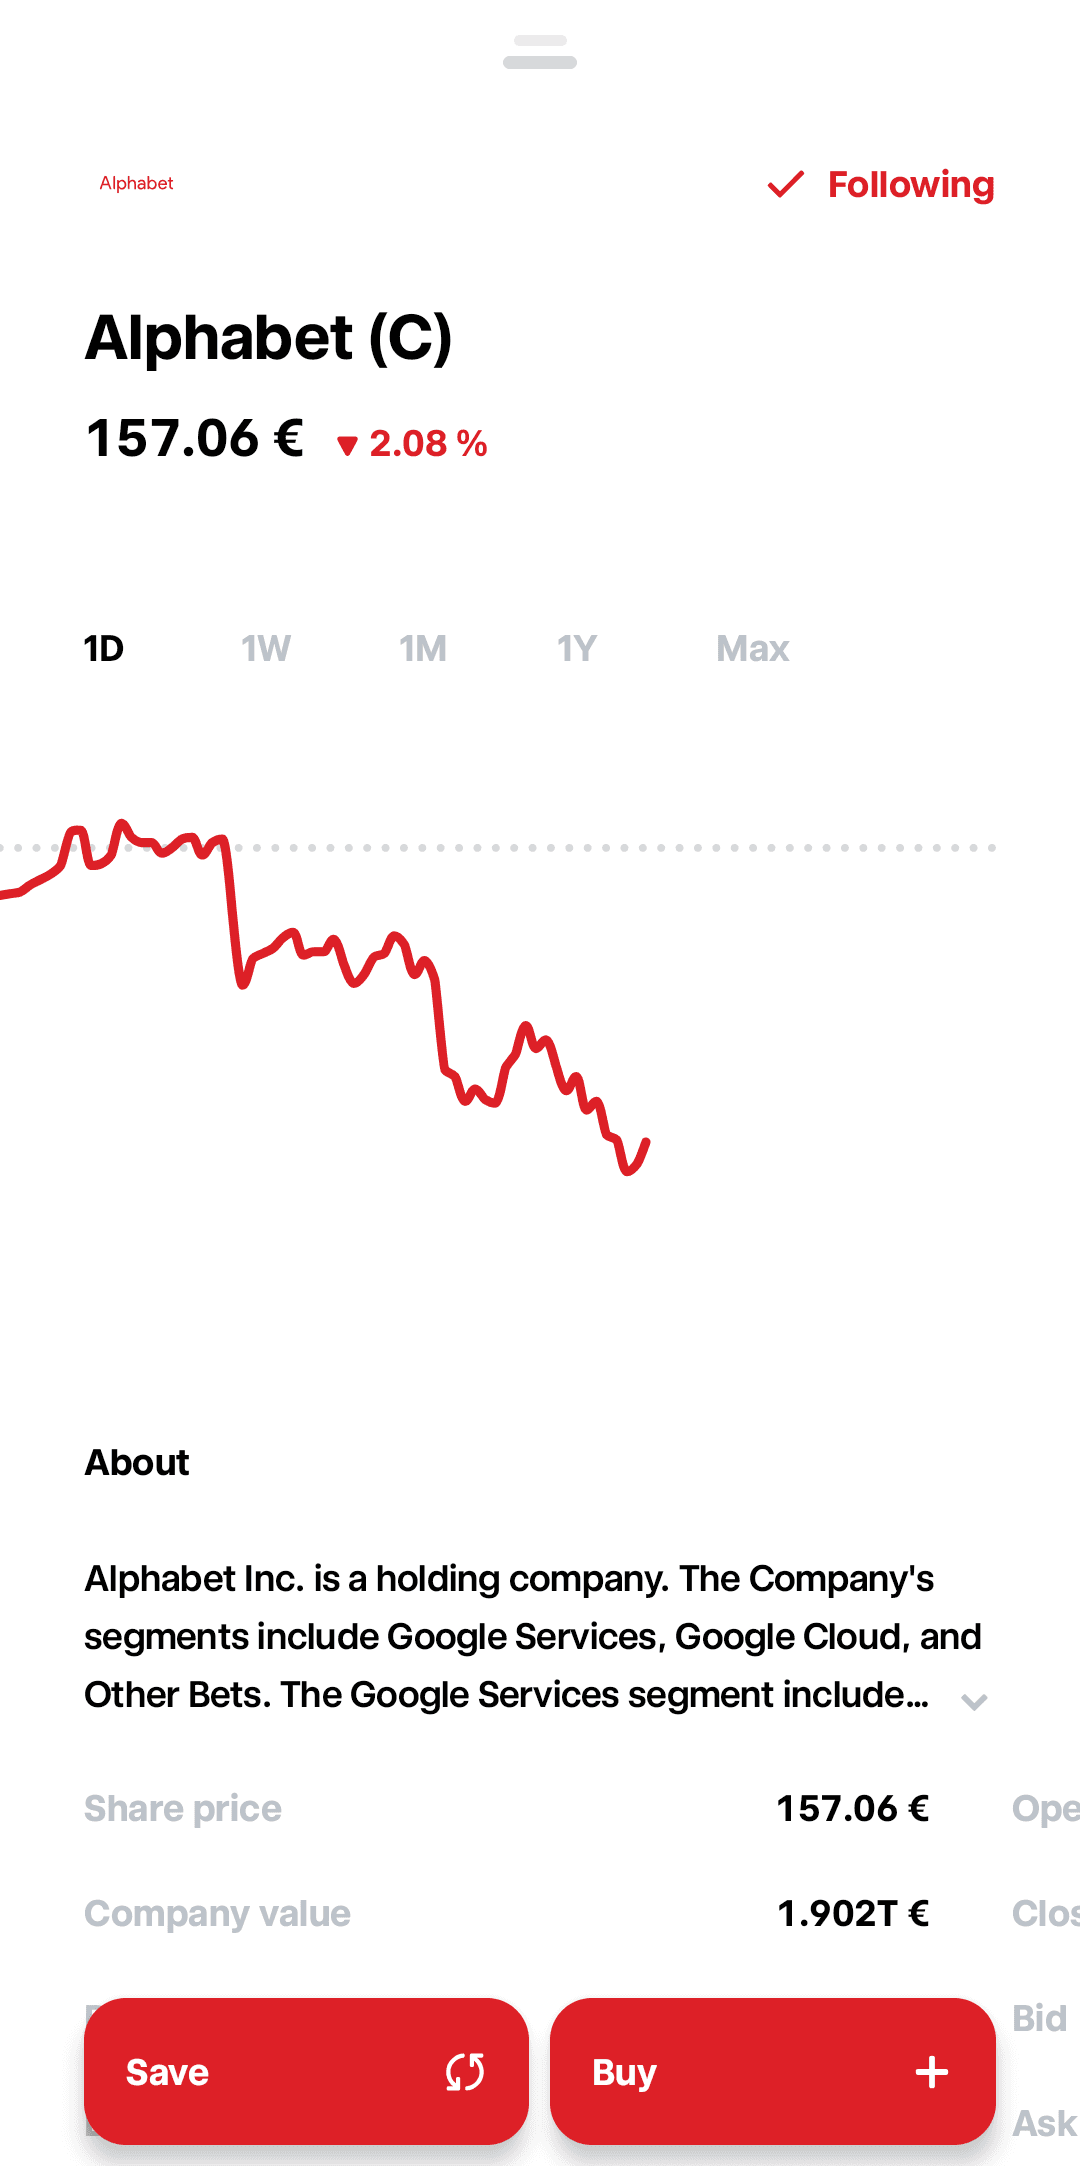
from the Trade Republic Android app
To ensure consistency across our app, we'll use the same WebView-based approach for both historical and intraday real-time data visualization. This provides a unified visual experience while simplifying maintenance, as we only need to maintain expertise in one charting technology stack.
To integrate real-time data into our WebView chart implementation, we need a strategy for updating the chart efficiently. Each approach has different implications for device resources such as battery life, processing power, and memory usage. Table 2 shows multiple options with their trade-offs:
| Option | Description | Advantages | Disadvantages |
|---|---|---|---|
| Direct UI updates | Update the UI instantly with every new data point received from the WebSocket. | Simplest implementation. Ensures users see the most current data. Minimal latency between data receipt and display. | Can cause UI jank if updates are too frequent. High battery consumption. May overwhelm the main thread with excessive updates. |
| Buffered updates | Collect data changes in a buffer and update the UI at fixed intervals. | Reduces UI update frequency. More efficient for battery life. Smooths out frequent changes. | Introduces a small delay in displaying the latest data. May miss intermediate price points. Requires careful tuning of update intervals. |
| Priority-based updates | Assign different update priorities to different UI elements. | Focuses resources on the most important data. Allows critical information to update more frequently. Better overall user experience. | More complex implementation. Requires careful tuning of priorities. May cause user confusion if related data elements update at different rates. |
Table 2: Trade-offs for displaying real-time UI updates
For our stock trading app's intraday chart, we'll implement the buffered updates approach. This strategy provides the best balance between responsiveness and resource efficiency for a single chart element.
📝 Note: This decision assumes we're displaying just one intraday chart with real-time updates at a time. If product requirements change to display multiple charts simultaneously, we would need to reconsider our strategy and implement a hybrid solution with priority-based updates.
Our buffered update implementation for the WebView-based intraday chart consists of several key components:
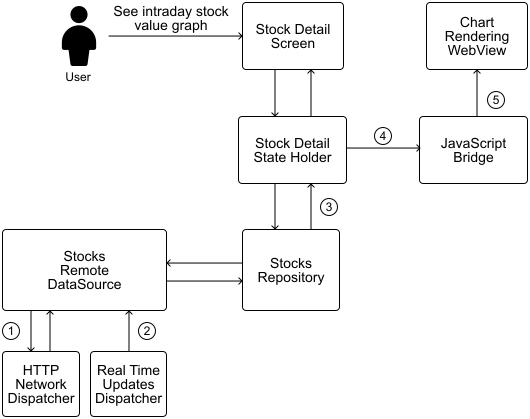
The stock chart runs as JavaScript within a WebView. Since the chart rendering happens in this JavaScript environment, we need a way to send our processed data from the native app to the WebView. This is where the JavaScript bridge comes in.
The JavaScript bridge creates a communication channel between our native app code and the WebView chart. When real-time stock data arrives, it first comes to our native code through the WebSocket connection, not directly to the WebView. This approach has several benefits:
This setup creates a clear separation of duties:
The JavaScript bridge allows data to flow both ways:
🛠️ Platform implementation details
Buffered updates require efficient data stream management that needs to be sent through the JavaScript bridge to update the WebView.
On Android, we can leverage:
The JavascriptInterface mechanism to establish reliable communication between native code and WebView charts.
Kotlin Flows with appropriate dispatchers to handle buffering and throttling off the main thread.
On iOS, we can leverage:
WKUserContentController and WKScriptMessageHandler enable native-to-JavaScript communication.
Combine framework's throttle and debounce operators to control update frequency.
Figure 6 maps the data journey when a user opens a stock's intraday chart, updating at real time:
Several common issues can still affect real-time UI performance:
As our app grows in complexity and user base, our real-time update system needs to scale accordingly. Several aspects of our design ensure this scalability:
🔍 Industry insights:
Institutions such as J.P. Morgan or Commerzbank, and trading platforms like Binomo, use SciChart's [9] native engine to power real-time stock dashboards [10].
Coinbase's exchange platform exposes a WebSocket feed to broadcast live market data for orders and trades [11].
In this chapter, we've designed a mobile stock trading app that delivers core functionality for investment management. Our system supports viewing real-time stock prices, executing trades through placing and canceling orders, analyzing historical price data through charts, and receiving timely price alerts.
The architecture combines REST APIs for standard operations with WebSockets for real-time updates. We've implemented a layered client architecture that separates UI and data concerns, making the codebase both maintainable and testable. We also covered creating both historical and real-time intraday stock value charts.
For those preparing to discuss this in a Mobile System Design interview, consider exploring these extensions to deepen the conversation:
[1] TradeRepublic's state of Android in 2024 with REST and WebSocket protocols:
https://engineering.traderepublic.com/state-of-android-at-tr-2024-edition-bc032620b83e
[2] API Gateway: https://en.wikipedia.org/wiki/API\_management\#gateway
[3] Robinhood's charts: https://robinhood.com/us/en/support/articles/using-charts/
[4] ETrade's charts: https://us.etrade.com/knowledge/library/getting-started/power-etrade-charting-enhancements
[5] MPAndroidChart: https://github.com/PhilJay/MPAndroidChart
[6] iOS Charts library: https://github.com/ChartsOrg/Charts
[7] TradingView: https://www.tradingview.com/
[8] Robinhood's Spark Android library: https://github.com/robinhood/spark
[9] SciChart: https://www.scichart.com/
[10] SciChart usage in the industry: https://www.scichart.com/blog/ios-android-native-apps-vs-javascript
[11] Coinbase WebSocket approach for real-time updates: https://docs.cdp.coinbase.com/exchange/docs/websocket-overview