Merge an array of intervals so there are no overlapping intervals, and return the resultant merged intervals.

Example:

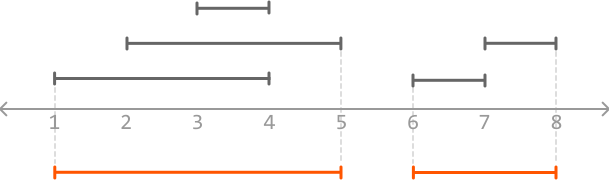
Image represents a Gantt chart illustrating task scheduling.  A horizontal time axis is numbered from 1 to 8, representing time units. Three dark-grey horizontal bars represent different tasks. The topmost bar spans from 2.5 to 3.5. The middle bar extends from 1.5 to 4.5. The third bar runs from 6.5 to 7.5. A longer, bright-orange bar sits at the bottom, starting at 1 and ending at 5, indicating a longer-duration task. Another shorter orange bar starts at 6 and ends at 8, representing another task.  The grey bars represent shorter tasks that are potentially concurrent with the longer orange tasks, with some overlap and some separation in time.  The dotted vertical lines at points 1, 5, and 8 on the time axis may indicate milestones or significant points in the schedule.
Input: intervals = [[3, 4], [7, 8], [2, 5], [6, 7], [1, 4]]
Output: [[1, 5], [6, 8]]

Constraints:

In Plain English

New to this one? Start here. Below is the core idea in everyday language, plus a real-world analogy—then the sections that follow build on it with the formal reasoning, code, and step-by-step walkthroughs.

📅 A real-world picture: tidying up a calendar

Imagine your calendar has a bunch of overlapping busy blocks — a call from 1–4, another from 2–5, a quick sync 3–4. To a colleague looking for a free slot, that entire mess is just “busy 1–5.” Merging intervals is exactly this clean-up: fuse everything that touches or overlaps into one solid busy block, so the schedule shows the fewest, widest blocks possible.

Intuition

There are two main challenges to this problem:

  1. Identifying which intervals overlap each other.
  2. Merging those intervals.

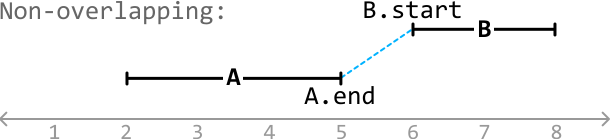
Let's start by tackling the first challenge. Consider two intervals, A and B, where interval A starts before B. Below, we visualize the case when these two intervals don't overlap:

Image represents a visualization of non-overlapping intervals on a number line.  The number line is labeled with integers from 1 to 8.  A thick black line labeled 'A' spans from approximately position 2 to 5 on the number line, with 'A.end' explicitly marking its right endpoint at 5.  Another thick black line labeled 'B' extends from approximately position 6 to 8, with 'B.start' clearly indicating its left endpoint at 6. A dashed light-blue line connects 'A.end' to 'B.start', visually representing the separation between the two intervals. The text 'Non-overlapping:' precedes the diagram, clarifying the relationship between the intervals A and B, emphasizing that they do not share any common points.

The dashed line above shows that interval A ends before interval B starts, which eliminates the possibility of B overlapping A. This indicates that intervals A and B will never overlap when A.end < B.start.

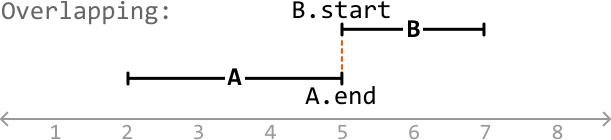
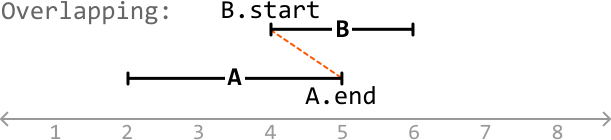
Now, consider a couple of cases where these two intervals do overlap:

Image represents a diagram illustrating the 'Overlapping' coding pattern.  A horizontal number line, ranging from approximately 1 to 8, serves as the timeline. Two segments, labeled 'A' and 'B,' are depicted on this timeline. Segment 'A' extends from approximately point 2 to point 5, with 'A.end' explicitly marked at point 5. Segment 'B' starts at point 5 ('B.start') and ends at approximately point 7.  A dashed orange vertical line connects the end of segment A ('A.end') and the start of segment B ('B.start'), visually highlighting the point of overlap between the two segments.  The segments are represented by thick black horizontal lines with perpendicular lines at their start and end points. The overall arrangement demonstrates how the end of one process (A) coincides with the beginning of another (B), indicating an overlapping execution or dependency.
Image represents a diagram illustrating overlapping intervals.  The diagram uses a horizontal number line ranging from approximately 1 to 8. Two intervals, labeled 'A' and 'B', are depicted. Interval 'A' is represented by a thick black line extending from approximately 2 to 5 on the number line, with labels 'A' and 'A.end' at its midpoint and right endpoint respectively. Interval 'B' is shown as a thick black line above 'A', starting at approximately 4 ('B.start' label) and ending at approximately 6. A dashed orange line connects the start of 'B' to the end of 'A', visually indicating an overlap between the two intervals. The text 'Overlapping:' is placed to the left of the intervals, providing context for the diagram's purpose.  The number line provides a visual scale to represent the start and end points of each interval.

In these cases, we see that B starts before (or when) A ends (A.end ≥ B.start). In other words, some portion of B overlaps A since interval A hasn't ended before interval B starts. Therefore, intervals A and B overlap when A.end ≥ B.start.

We have now established the two cases that cover all overlapping and non-overlapping scenarios for two intervals, given interval A starts before interval B:

To apply these conditions to any two intervals in the input, it's useful to have a way to identify which interval starts first. One idea is to sort the intervals by their start value, which will make it clear which one of each two adjacent intervals starts first.

Merging intervals
With the above logic in mind, let's tackle an example. Consider the following intervals:

Image represents a sequence of five distinct arrays, each enclosed in square brackets `[]` and containing two integer elements separated by a comma `,`.  The arrays are arranged horizontally, adjacent to one another without any intervening spaces.  The first array contains the integers 3 and 4; the second, 7 and 8; the third, 2 and 5; the fourth, 6 and 7; and the fifth, 1 and 4.  No information flows between the arrays; they are presented as independent data structures.  There are no URLs or parameters present.

The first step is to sort these intervals by start value:

Image represents a diagram illustrating a sorting operation on a list of sub-lists.  The top row shows five sub-lists, each containing two numbers: [3, 4], [7, 8], [2, 5], [6, 7], and [1, 4].  A downward-pointing arrow labeled 'sort' connects the top and bottom rows. The bottom row displays the same five sub-lists, but now each sub-list is sorted in ascending order: [1, 4], [2, 5], [3, 4], [6, 7], and [7, 8].  The diagram visually demonstrates the application of a sorting algorithm to each individual sub-list, leaving the order of the sub-lists themselves unchanged.

To aid the explanation, let's represent the intervals visually:

Image represents a visualization of intervals on a number line.  The label 'intervals:' is positioned to the left of the diagram. A horizontal grey number line is shown, ranging from 1 to 8, marked with integer values. Above the number line are four horizontal grey line segments representing intervals. The first interval spans from approximately 1.2 to 4, the second from approximately 2 to 5, the third from approximately 3 to 3.5, and the fourth from approximately 6.5 to 7.5. Each interval is depicted as a line segment with small perpendicular lines at both ends, indicating the start and end points of the interval on the number line.  The intervals are not explicitly labeled but are visually distinct from each other and their positions relative to the numbered line clearly show their range.

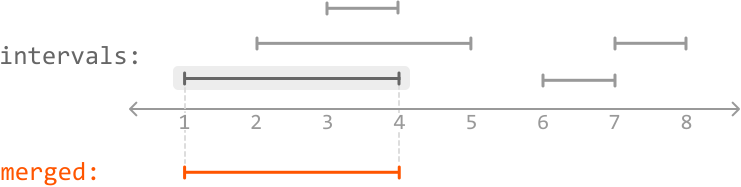
Let's add/merge each interval into a new array called merged, starting with the first one, which we can add to the merged array straight away as it's the first interval:

Image represents a visual illustration of merging overlapping intervals.  The image displays a number line ranging from 1 to 8. Above the number line, labeled 'intervals:', are several horizontal gray line segments representing individual intervals.  These intervals are: a short segment spanning approximately 1.5 to 2.5, a longer segment from approximately 2 to 5, a shorter segment around 6 to 7, and a very short segment near 7.5 to 8. Below the number line, labeled 'merged:', is a single, longer orange line segment that spans from approximately 1 to 4. This orange segment represents the result of merging all overlapping gray intervals. Dotted vertical lines connect the endpoints of the longest gray interval (from 2 to 5) to the corresponding points on the merged orange interval, visually demonstrating the merging process. The gray intervals are shown to illustrate the input, while the orange interval shows the output after merging overlapping intervals.

After the first interval is added, we start the process of merging. Let's define A as the last interval in the merged array and B as the current interval in the input. This makes sense since the interval in the merged array (A) starts before or at the same time as B.

We notice B starts before A ends, indicating an overlap. So, let's merge them:

Image represents a visual explanation of interval merging in a coding pattern.  The image displays a number line spanning from 1 to 8. Above the number line, labeled 'intervals:', are two grey horizontal line segments representing intervals. The top segment, labeled 'B.start' and 'B', extends from approximately 2.5 to 4.5. The second segment extends from approximately 6 to 7. Below the number line, labeled 'merged:', is an orange horizontal line segment labeled 'A' and 'A.end', extending from approximately 1 to 5. To the right, a dashed-line box contains the condition 'A.end ≥ B.start (overlap)' and an arrow pointing right indicating the action '→ merge A and B'. This illustrates that if the end of interval A is greater than or equal to the start of interval B (indicating an overlap), then intervals A and B should be merged.  The visual representation clearly shows the relationship between the intervals and the merging logic.

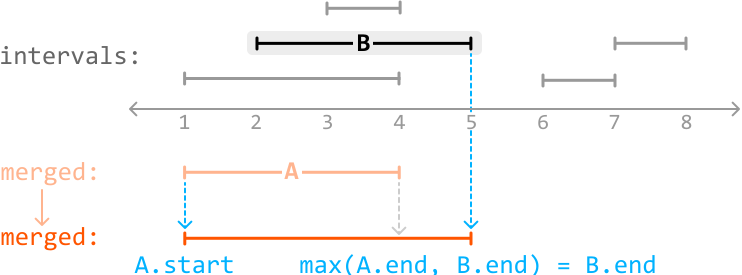
When merging A and B, we use the leftmost start value and the rightmost end value between them. Since A will always start before or at the same time as B, we always use A.start as the start point. This means we just need to identify the end point, which is the largest value between the end points of A and B:

Image represents a visual explanation of merging overlapping intervals.  The top section shows a number line from 1 to 8 with three gray horizontal line segments representing intervals.  One segment spans approximately from 1.5 to 4, another from 6.5 to 7.5, and a third, labeled 'B', spans from approximately 2 to 5.  Below this, a light-orange segment labeled 'A' is shown, spanning from approximately 1 to 4.  Dashed light-blue arrows connect the end of interval A and the end of interval B to a final, merged orange interval below. This final interval starts at the beginning of interval A (labeled 'A.start') and ends at the maximum of the ends of intervals A and B (labeled 'max(A.end, B.end) = B.end'), visually demonstrating how the merging process combines overlapping intervals into a single, larger interval.  The text 'intervals:' and 'merged:' labels the different sections of the diagram.

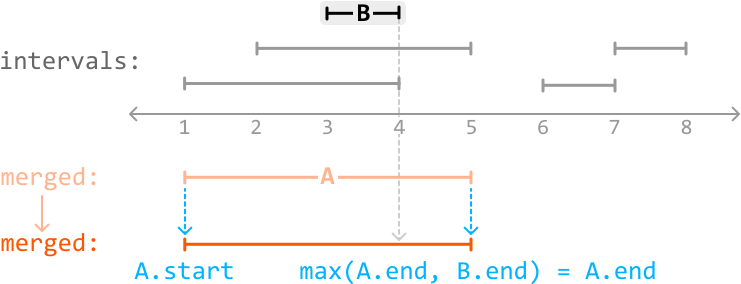
We can apply the same logic to the next interval:

Image represents a visual explanation of merging overlapping intervals.  The top section, labeled 'intervals:', shows a number line from 1 to 8 with two sets of gray intervals.  The first interval, labeled 'B.start' at the top, extends from approximately 2 to 4.  A second gray interval runs from approximately 1 to 4. A third interval extends from approximately 6 to 7, and a fourth from approximately 7 to 8. The bottom section, labeled 'merged:', displays a single orange interval labeled 'A' that spans from approximately 1 to 5, representing 'A.end'.  To the right, a dashed-line box explains the merging logic: 'A.end ≥ B.start (overlap)' indicates that if the end of interval A is greater than or equal to the start of interval B, then the intervals overlap ('→ merge A and B').  This implies that the merging process combines overlapping intervals into a single, larger interval.
Image represents a visual explanation of merging overlapping intervals.  The top section, labeled 'intervals:', shows two sets of gray intervals on a number line ranging from 1 to 8.  One interval extends from approximately 1.5 to 4, and another from 4 to 5. A third interval runs from 6.5 to 7.5, and a fourth from approximately 7 to 8. A separate, shorter interval labeled 'B' is centered at 4, overlapping with the first two intervals. The middle section, labeled 'merged:', shows a peach-colored interval labeled 'A' extending from approximately 1.5 to 5, representing a merging of the first two intervals.  Dashed light-blue lines indicate the merging process, connecting the endpoints of the original intervals to the new merged interval. The bottom section, also labeled 'merged:', displays a solid orange interval representing the final merged result. This interval starts at the beginning of the first interval (labeled 'A.start') and ends at the maximum value between the end of interval A (5) and the end of interval B (4), which is 5 (indicated by 'max(A.end, B.end) = A.end').  The orange interval visually demonstrates the final merged interval after considering the overlap.

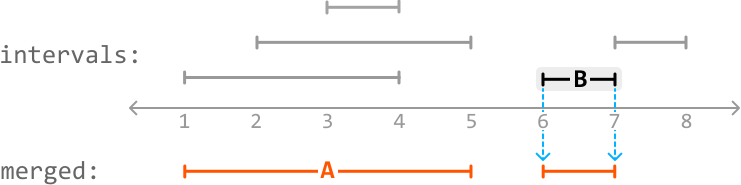
When we reach the fourth interval, we notice B starts after A ends, indicating there is no overlap.

Image represents a visual explanation of a merging algorithm for intervals.  The top section, labeled 'intervals:', shows two horizontal grey lines representing intervals on a numbered axis (1 to 8). The first interval extends from approximately 1.5 to 4, and the second, labeled 'B', starts at 6 and ends at 8.  A smaller grey rectangle labeled 'B' is centered on the second interval to highlight it. The bottom section, labeled 'merged:', displays a single orange line labeled 'A' extending from approximately 1 to 5, representing a merged interval.  'A.end' is labeled at the right end of this orange line. A dashed-line box to the right explains the condition for merging: 'A.end < B.start (no overlap)' which indicates that if the end of interval A is less than the start of interval B (meaning no overlap), then B is added to the merged list.  The arrow within the box points to the right, indicating the direction of the data flow (adding B to the merged list).

So, we just add it as a new interval to the merged array:

Image represents a visual illustration of merging intervals.  The top section, labeled 'intervals:', shows three horizontal gray lines representing intervals on a number line ranging from 1 to 8. The first interval extends from approximately 2 to 5, the second from approximately 1 to 4, and the third from approximately 7 to 8. Below, a number line is shown with numerical markers from 1 to 8. A black horizontal line labeled 'B' is positioned above the number line, spanning from approximately 6 to 7.  Dashed light-blue lines descend from the endpoints of interval 'B' to the number line below. The bottom section, labeled 'merged:', displays a single, longer orange horizontal line labeled 'A,' extending from approximately 1 to 8, representing the merged intervals. This line visually demonstrates the result of combining the intervals shown above, indicating that the merging process combines overlapping or adjacent intervals into a single, larger interval.

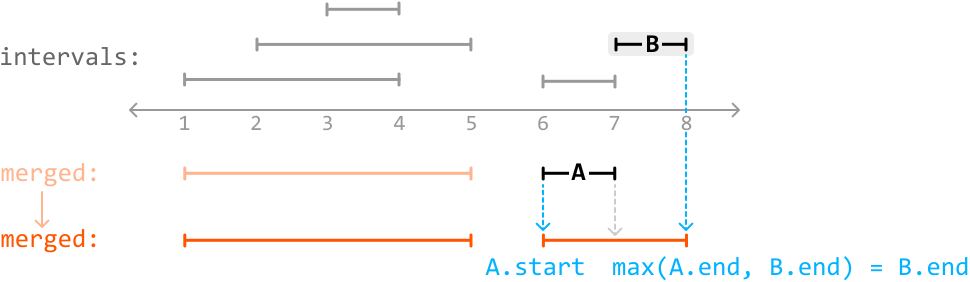
The next interval, B, overlaps the last interval in the merged array, A, since B starts when A ends (A.end == B.start).

Image represents a visual explanation of merging overlapping intervals.  The top section displays three gray horizontal line segments labeled 'intervals:' representing three separate intervals on a numbered axis ranging from 1 to 8. The first interval spans approximately from 1.5 to 4.5, the second from 2.5 to 5, and the third from 6 to 7.  Below, labeled 'merged:', a single longer orange line segment shows the result of merging these intervals, extending from approximately 1.5 to 7.  To the right, a smaller gray line segment labeled 'B.start' and 'B' is shown, partially overlapping with the rightmost gray interval from the top section. A dashed-line box contains the condition 'A.end ≥ B.start (overlap)' and an arrow indicating 'merge A and B,' explaining the merging logic: if the end of interval A is greater than or equal to the start of interval B, then intervals A and B are merged.  The labels 'A.end' and 'A' are used to denote the end point and the interval A respectively in the merged interval and the condition.

So, let's merge A with B:

Image represents a visual explanation of merging overlapping intervals.  The top section, labeled 'intervals:', shows three gray horizontal line segments representing intervals on a number line ranging from 1 to 8.  The first segment spans approximately from 1.5 to 4.5, the second from 1.8 to 5, and the third from 6.2 to 7.2. Below, labeled 'merged:', a light-orange segment appears, representing the merging of the first two intervals, spanning approximately from 1.5 to 5.  Further below, labeled 'merged:', a final orange segment illustrates the complete merging of all three intervals, extending from approximately 1.5 to 8.  Dashed cyan lines connect the right end of the third gray interval (labeled 'B') to the right end of the final orange interval, indicating its influence on the final merged interval's endpoint.  Similarly, dashed cyan and gray lines connect the interval labeled 'A' (the merged first two intervals) to the final merged interval, showing how its start and end points contribute to the final merged interval's boundaries. The text 'A.start max(A.end, B.end) = B.end' under the final merged interval clarifies that the final interval's end point is determined by the maximum of the end points of intervals A and B.

After processing the last interval, we've successfully merged all intervals.

Implementation

from typing import List
from ds import Interval
    
def merge_overlapping_intervals(intervals: List[Interval]) -> List[Interval]:
    intervals.sort(key=lambda x: x.start)
    merged = [intervals[0]]
    for B in intervals[1:]:
        A = merged[-1]
        # If A and B don't overlap, add B to the merged list.
        if A.end < B.start:
            merged.append(B)
        # If they do overlap, merge A with B.
        else:
            merged[-1] = Interval(A.start, max(A.end, B.end))
    return merged
vector<Interval> mergeOverlappingIntervals(vector<Interval> intervals) {
    if (intervals.empty()) {
        return {};
    }
    sort(intervals.begin(), intervals.end(),
         [](const Interval& a, const Interval& b){ return a.start < b.start; });
    vector<Interval> merged;
    merged.push_back(intervals[0]);
    for (int i = 1; i < (int)intervals.size(); i++) {
        Interval B = intervals[i];
        if (merged.back().end < B.start) {
            merged.push_back(B);                                    // gap: B starts a new run
        } else {
            merged.back().end = max(merged.back().end, B.end);      // overlap: extend the run
        }
    }
    return merged;
}
List<Interval> mergeOverlappingIntervals(List<Interval> intervals) {
    if (intervals.isEmpty()) return new ArrayList<>();
    intervals.sort((a, b) -> a.start - b.start);
    List<Interval> merged = new ArrayList<>();
    merged.add(intervals.get(0));
    for (int i = 1; i < intervals.size(); i++) {
        Interval B = intervals.get(i);
        Interval A = merged.get(merged.size() - 1);
        if (A.end < B.start) merged.add(B);
        else merged.set(merged.size() - 1, new Interval(A.start, Math.max(A.end, B.end)));
    }
    return merged;
}

Complexity Analysis

Time complexity: The time complexity of merge_overlapping_intervals is O(nlog(n))O(nlog(n)), where nn denotes the number of intervals. This is due to the sorting algorithm. The process of merging overlapping intervals itself takes O(n)O(n) time because we iterate over every interval.

Space complexity: The space complexity depends on the space used by the sorting algorithm. In Python, the built-in sorting algorithm, Tim sort, uses O(n)O(n) space. Note that the merged array is not considered in the space complexity calculation because we're only concerned with extra space used, not space taken up by the output.

Interview Tip

Tip: Visualize intervals to uncover logic and edge cases.
Managing intervals and handling edge cases is much easier when visualizing example inputs. Drawing examples also helps your interviewer follow along with your reasoning and understand your thought process.

Dry Runs

Two step-by-step walkthroughs of the algorithm below: a valid case (the expected happy path) and an invalid / edge case that exercises the tricky parts. Each step shows the program state as the code runs—the same steps apply to Python, C++ and Java.

✅ Dry run 1 (rich — things merge) — intervals = [[3,4],[7,8],[2,5],[6,7],[1,4]]

Step 0 — sort by start → [[1,4],[2,5],[3,4],[6,7],[7,8]]. Here is the sorted picture on a number line (result at the bottom):

Overlapping or touching intervals collapse into one run — the five inputs merge into [1,5] and [6,8] (green).

finalized run current run (tail A) just extended

seed: answer starts with the first interval.
[1,4]
B=[2,5]: A=[1,4], A.end 4 ≥ 2 → overlap. Extend end to max(4,5)=5.
[1,5]
B=[3,4]: A=[1,5], 5 ≥ 3 → overlap (B is nested). max(5,4)=5, so the run is unchanged.
[1,5]
B=[6,7]: A=[1,5], 5 < 6 → gap. Finalize [1,5] and start a new run.
[1,5]
[6,7]
B=[7,8]: A=[6,7], 7 ≥ 7 → they touch. Extend end to max(7,8)=8.
[1,5]
[6,8]
final output: [[1,5], [6,8]]

The same run as a table

Overlap test is A.end ≥ B.start. Extend keeps the larger end.
B (incoming)A (tail)A.end ≥ B.start?actionanswer after
— (seed)start run [1,4][1,4]
[2,5][1,4]4≥2  yesextend → max(4,5)=5[1,5]
[3,4][1,5]5≥3  yesextend → max(5,4)=5[1,5]
[6,7][1,5]5≥6  nogap → new run[1,5],[6,7]
[7,8][6,7]7≥7  yesextend → max(7,8)=8[1,5],[6,8]
❗ Dry run 2 (no overlaps — nothing merges) — intervals = [[8,9],[1,3],[4,6]]

Step 0 — sort by start → [[1,3],[4,6],[8,9]]. Every interval sits in its own lane; watch the near-miss between 3 and 4.

[1,3] ends at 3 and [4,6] starts at 4 — a gap of 1, so they do not merge. The result is unchanged: [1,3], [4,6], [8,9].

finalized run current run (tail A) gap — no merge

seed: answer starts with [1,3].
[1,3]
B=[4,6]: A=[1,3], A.end 3 < 4 → gap. Off by just 1, so no merge — new run.
[1,3]
[4,6]
B=[8,9]: A=[4,6], 6 < 8 → gap again. New run.
[1,3]
[4,6]
[8,9]
final output: [[1,3], [4,6], [8,9]] — identical to the input ✓

The same run as a table

When the test A.end ≥ B.start is always false, every interval opens its own run.
B (incoming)A (tail)A.end ≥ B.start?actionanswer after
— (seed)start run [1,3][1,3]
[4,6][1,3]3≥4  nogap → new run[1,3],[4,6]
[8,9][4,6]6≥8  nogap → new run[1,3],[4,6],[8,9]

Take-away: the merge decision hinges on a single comparison. A gap of even 1 (3 then 4, on closed integer intervals) is still a gap. Get the < vs boundary right and this problem is solved.

The same steps in each language

intervals.sort(key=lambda x: x.start) sorts in place. The answer lives in merged; to extend the run we replace its last element with merged[-1] = Interval(A.start, max(A.end, B.end)).

A comparator lambda a.start < b.start drives sort. Because merged stores values, we extend by writing straight into merged.back().end.

intervals.sort((a,b) -> a.start - b.start) orders by start. To extend we build a fresh Interval and merged.set(last, new Interval(...)). The logic is line-for-line the same as Python and C++.