Given an integer array nums, return an output array res where, for each value nums[i], res[i] is the first number to the right that's larger than nums[i]. If no larger number exists to the right of nums[i], set res[i] to ‐1.
New to this one? Start here. Below is the core idea in everyday language, plus a real-world analogy—then the sections that follow build on it with the formal reasoning, code, and step-by-step walkthroughs.
🌱 A real-world picture: who’s the next taller person ahead?
People of different heights stand in a line, all facing right. Each person wants to know: who is the first person ahead of me taller than me? A short person’s answer might be the very next person; a tall person might have to wait a long time — or find nobody. We’ll keep a stack of people still waiting for their taller person, and resolve them the instant someone tall enough walks up.
Intuition
A brute-force solution to this problem involves iterating through each number in the array and, for each of these numbers, linearly searching to their right to find the first larger number. This approach takes O(n2) time, where n denotes the length of the array. Can we think of something better?
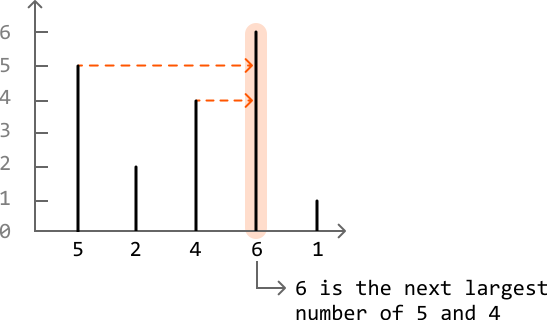
Let’s approach this problem from a different perspective. Instead of finding the next largest number for each value, what if we check whether the value itself is the next largest number for any value(s) to its left? For example, can we figure out which values in the following example have 6 as their next largest number?:
With this shift in perspective, we should search the array from right to left: certain values we encounter from the right could potentially be the next largest number of values to their left. Let’s call these values “candidates.” But how do we determine which numbers qualify as candidates?
Consider the example below:
Let’s start at the rightmost index, where the only value we know initially is 4:
Right now, we can say 4 is a candidate as it might be the next largest number of values to its left. No candidates have been encountered before 4 because it’s the rightmost element, so we should mark the result for 4 in res as -1:
Next, we encounter a 2. The next largest number of 2 is the most recently added candidate that’s larger than it. In this case, the rightmost candidate in the candidates list represents the most recently added candidate, which is 4 in this case.
Record 4 as the next largest number of 2 in res, and then add 2 to the candidates list because it could be the next largest number of elements to its left:
The next number is 3. Notice that with the introduction of 3, number 2 should no longer be considered a candidate. This is because it’s now impossible for 2 to be the next largest number of any value to its left. Since 3 is both larger and further to the left, it will always be prioritized over 2 as the next largest number. So, let’s remove 2 from the candidates list, as well as any other candidate that’s less than or equal to 3:
Since we removed all candidates smaller than 3, the rightmost candidate is now 4. So, let’s record 4 as the next largest number of 3 in res and add 3 to the candidates list:
This provides a crucial insight:
Whenever we move to a new number, all candidates less than or equal to this number should be removed from the candidates list.
Another key observation is that the list of candidates always maintains a strictly decreasing order of values. This is because we always remove candidates less than or equal to each new value, ensuring values are added in decreasing order. We can see this more clearly in the final state of the candidates list of the previous example:
This indicates a stack is the ideal data structure for storing the candidates list, since stacks can be used to efficiently maintain a monotonic decreasing order of values, as mentioned in the introduction.
The top of the stack represents the most recent candidate to the right of each new number encountered. Given this, here’s how to use the stack to add and remove candidates at each value:
Pop off all candidates from the top of the stack less than or equal to the current value.
The top of the stack will then represent the next largest number of the current value.
Record the top of the stack as the answer for the current value.
If the stack is empty, there’s no next largest number for the current value. So, record -1.
Add the current value as a new candidate by pushing it to the top of the stack.
Implementation
from typing import List

def next_largest_number_to_the_right(nums: List[int]) -> List[int]:
    res = [0] * len(nums)
    stack = []
    # Find the next largest number of each element, starting with the rightmost
    # element.
    for i in range(len(nums) - 1, -1, -1):
        # Pop values from the top of the stack until the current value's next largest
        # number is at the top.
        while stack and stack[-1] <= nums[i]:
            stack.pop()
        # Record the current value's next largest number, which is at the top of the
        # stack. If the stack is empty, record -1.
        res[i] = stack[-1] if stack else -1
        stack.append(nums[i])
    return res
vector<int> nextLargestNumberToTheRight(vector<int>& nums) {
    int n = nums.size();
    vector<int> res(n, -1);
    vector<int> stack;                        // indices, values decreasing
    for (int i = 0; i < n; i++) {
        while (!stack.empty() && nums[stack.back()] < nums[i]) {
            res[stack.back()] = nums[i];
            stack.pop_back();
        }
        stack.push_back(i);
    }
    return res;
}
public int[] nextLargestNumberToTheRight(int[] nums) {
    int n = nums.length;
    int[] res = new int[n];
    Arrays.fill(res, -1);
    Deque<Integer> stack = new ArrayDeque<>();   // indices, values decreasing
    for (int i = 0; i < n; i++) {
        while (!stack.isEmpty() && nums[stack.peek()] < nums[i]) {
            res[stack.pop()] = nums[i];
        }
        stack.push(i);
    }
    return res;
}
Complexity Analysis
Time complexity: The time complexity of next_largest_number_to_the_right is O(n). This is because each value of nums is pushed and popped from the stack at most once.
Space complexity: The space complexity is O(n) because the stack can potentially store all n values.
Dry Runs
Two step-by-step walkthroughs of the algorithm below: a valid case (the expected happy path) and an invalid / edge case that exercises the tricky parts. Each step shows the program state as the code runs—the same steps apply to Python, C++ and Java.
✅ Dry run 1 (rich mix) — nums = [5, 2, 4, 6, 3, 1]. Watch 6 clear out several waiters at once.
just pushed (now waiting) resolved & popped
i=0, num=5. Stack empty → 5 starts waiting.
50
i=1, num=2. 2 < 5, so it resolves no one → 2 waits behind 5.
50
21
i=2, num=4. 4 > 2 → pop 2, set res[1]=4. 4 < 5, stop. 4 waits.
50
21
42
i=3, num=6. 6 > 4 → pop 4, res[2]=6. 6 > 5 → pop 5, res[0]=6. Stack empty; 6 waits.
End. The three still waiting (indices 3, 4, 5) never met a bigger number → they keep -1. Result: [6, 4, 6, -1, -1, -1]. 🎉
The same run as a table
A single big value (6) can resolve many waiters at once — that’s why it’s still O(n) overall.
i
num
who gets resolved
stack after (values)
0
5
—
[5]
1
2
—
[5, 2]
2
4
res[1]=4
[5, 4]
3
6
res[2]=6, res[0]=6
[6]
4
3
—
[6, 3]
5
1
—
[6, 3, 1]
—
—
leftovers stay -1
res = [6,4,6,-1,-1,-1]
❌ Dry run 2 (degenerate) — nums = [7, 5, 3, 1], strictly decreasing. Nobody ever has a larger number ahead, so every answer is -1.
just pushed (now waiting) resolved & popped
i=0, num=7 → waits.
70
i=1, num=5. 5 < 7, resolves no one → waits.
70
51
i=2, num=3. 3 < 5, resolves no one → waits.
70
51
32
i=3, num=1. 1 < 3, resolves no one → waits. The while loop never once popped.
70
51
32
13
End. All four are still waiting → result is [-1, -1, -1, -1]. 🎉
The same run as a table
When the array only ever goes down, the stack just grows — the “pop” branch never fires.
i
num
who gets resolved
stack after (values)
0
7
—
[7]
1
5
—
[7, 5]
2
3
—
[7, 5, 3]
3
1
—
[7, 5, 3, 1]
—
—
nobody resolved
res = [-1,-1,-1,-1]
This is the worst case for the brute force (every scan runs to the end) but the stack still touches each index just twice: one push, and one final “left over.”
The same steps in each language
The list stores indices; nums[stack[-1]] reads the waiting value, and res[stack.pop()] = nums[i] resolves and removes it in one line.
Same steps with a vector<int> of indices: nums[stack.back()] peeks the value; stack.pop_back() removes the resolved index.
Same steps with an ArrayDeque<Integer>: nums[stack.peek()] peeks; res[stack.pop()] = nums[i]. The Integer auto-unboxes cleanly when used as an array index.
![The image represents a bar chart illustrating a data transformation or accumulation process. The horizontal axis displays an unsorted sequence of numerical values (5, 2, 4, 6, 1), each represented by a black vertical bar whose height corresponds to its magnitude. Below the chart, a list `res = [6 4 6 -1 -1]` shows the resulting data after some operation. Dashed orange arrows connect the tops of the bars to corresponding values in the `res` list, indicating a mapping or transformation. For instance, the bar representing '5' maps to '6' in the `res` list, the bar representing '2' maps to '4', and so on. The vertical axis represents the magnitude of the values, ranging from 0 to 6. The chart visually demonstrates how the input values are processed to produce the output values in the `res` list, suggesting a potential algorithm involving accumulation or modification of the input sequence. The negative values in `res` suggest a possible subtraction or other negative transformation applied to some input values.](images/img-712c5a33dcb0.svg)
![Image represents a bar chart illustrating a frequency distribution. The horizontal axis displays a sequence of numbers: [1, 1, 2, 3, 2, 3, 2, 4], representing data points. The vertical axis represents frequency, ranging from 0 to 4. Above each number on the horizontal axis, a vertical bar extends upwards to a height corresponding to its frequency of occurrence within the sequence. For instance, the number '1' appears twice, thus its bar reaches the height of '1' on the vertical axis; the number '2' appears three times, resulting in its bar reaching the height of '2'; the number '3' appears twice, reaching the height of '2'; and the number '4' appears once, reaching the height of '4'. The chart visually summarizes the frequency of each unique value in the given data set.](images/img-f027ae0f716f.svg)
![Image represents a Cartesian coordinate system illustrating a data structure or algorithm, possibly related to candidate selection or a similar process. The horizontal axis depicts an array or list, labeled `[ ... 4 ]` at its ends, suggesting a sequence of elements where '4' is the last visible element, and ellipses (...) indicate unseen preceding elements. The vertical axis represents a numerical value or index, ranging from 0 to 4. A vertical line segment extends from the horizontal axis at the point labeled '4' to the top of the diagram, indicating a selection or operation focused on the element '4'. To the right, the text `candidates = []` shows an empty array or list named 'candidates', suggesting this structure might store selected elements. The text `res = []` similarly shows an empty array named 'res', likely representing the results or output of the process. The downward-pointing arrow above the vertical line suggests data flow or an operation being performed on the element '4'. The overall diagram likely visualizes a step in an algorithm where the element '4' is being processed or selected, with the 'candidates' and 'res' arrays potentially storing intermediate or final results.](images/img-cff1a7f03de4.svg)
![Image represents a Cartesian coordinate system illustrating a step in a coding pattern, possibly related to backtracking or a similar algorithm. The horizontal axis represents an index or iterator, with values implicitly ranging from an unspecified starting point to 4, indicated by the label `[... 4]`. The vertical axis represents a value or counter, ranging from 0 to 4. A vertical line segment extends from the horizontal axis at the point x=4, reaching a value of approximately 4 on the y-axis. To the right of the coordinate system, the text `candidates = [4]` indicates a list or array named `candidates` containing the single element 4. Below this, `res = [-1]` shows a list or array named `res` containing the single element -1, highlighted in a peach-colored box. The downward-pointing arrow above the vertical line suggests a process is occurring at index 4, potentially modifying the `res` array. The overall diagram likely visualizes a state within an iterative algorithm where the `candidates` list is being processed, and the `res` list is being updated.](images/img-f87da6299e46.svg)
![Image represents a Cartesian coordinate system illustrating a step in a coding algorithm, possibly related to backtracking or dynamic programming. The horizontal axis shows a range of values, with labeled points at 2 and 4, implying a discrete domain. The vertical axis represents a count or index, ranging from 0 to 4. Two vertical lines are drawn at x=2 and x=4, extending from the horizontal axis to y=2 and y=4 respectively. A dashed orange arrow points from the line at x=2 to the line at x=4, indicating a transition or step in the algorithm. Below the horizontal axis, `res = [ ... 4 -1]` is shown, suggesting a result array or list where '4' (highlighted in peach) is a current value and '-1' might represent a placeholder or a special value. To the right, `candidates = [4 2]` is displayed, indicating a list of candidate values used by the algorithm. The overall diagram visualizes a process where the algorithm moves from a state represented by the line at x=2 to a state represented by the line at x=4, updating the `res` array in the process, using values from the `candidates` list.](images/img-8c8dbcddfbc7.svg)
![Image represents a graphical illustration of a filtering process within a coding pattern, likely related to candidate selection or data pruning. A horizontal axis displays a sequence of numbers, including 2, 3, and 4, representing candidate values. Vertical lines of varying styles indicate the presence and status of these candidates. A solid black vertical line at '3' and '4' signifies that these candidates are initially present. A dashed red vertical line at '2' shows it as a candidate that will be removed. A downward-pointing grey arrow above the '3' suggests a filtering operation is being applied. To the right, the text 'remove all candidates ≤ 3:' in red describes the filtering criterion, while 'candidates = [4 2]' shows the initial candidates, and 'candidates = [4]' shows the candidates after filtering. Below, 'res = [4 -1]' likely represents the result of a subsequent operation on the remaining candidates. The vertical axis likely represents a frequency or some other metric, but its scale is not explicitly defined. The overall diagram visually demonstrates the removal of candidates based on a specified condition, resulting in a filtered set of candidates.](images/img-80b30f87e837.svg)
![Image represents a graphical depiction of a step in an algorithm, possibly related to candidate selection or a similar process. The core of the image is a Cartesian coordinate system with a horizontal x-axis and a vertical y-axis ranging from 0 to 4. Along the x-axis, a partially visible array `[ ... 3 2 4]` is shown, indicating a sequence of numbers. Two vertical lines, one black and one light gray, represent elements within this array. The black line is positioned at x=3 and extends vertically to y=3, while the light gray line is at x=2 and extends to y=1. A dashed orange arrow points horizontally from the top of the black line (at y=3) to a second black line positioned at x=4, extending vertically to y=4. Below the x-axis, the text `candidates = [4 3]` is displayed, suggesting these are the current candidates being considered. Additionally, `res = [ 4 4 -1]` is shown, likely representing the results or output of the algorithm so far, with the number 4 highlighted in a peach color. The downward-pointing gray arrow above the first black line indicates the current processing step. The overall diagram illustrates a transition or movement of data, possibly a value of 3, from one position in the array to another, updating the `candidates` and `res` arrays accordingly.](images/img-5eda0afe592c.svg)
![Image represents a bar graph combined with a line graph illustrating a coding pattern. The x-axis displays a sequence of numbers: [1, 1, 2, 3, 2, 3, 2, 4], representing an input array. Above each x-axis value, a vertical bar is drawn; the height of the bar corresponds to the values in a second array, `res = [2, 2, 3, 4, 3, 4, 4, -1]`, shown below the x-axis. The bars are black for positive values in `res` and light gray for the last value (-1). An orange line connects points representing a cumulative sum or another derived value from the `res` array. This line starts at (1,1) and increases with each subsequent point, indicating a trend. Separately, a rectangular box displays the array `candidates = [4, 3, 2, 1]`, which is labeled as 'decreasing,' indicating the array's elements are in descending order. An orange arrow points from the `candidates` array to the right, visually connecting it to the graph, suggesting that the `candidates` array is the input or a related data structure used to generate the graph's data.](images/img-d9205a0a28b6.svg)